HAIL MAPS AND RISK INDICES: TOOLS FOR HAIL MONITORING

The detection of hail events has always been a complex challenge due to the typically localised nature of these phenomena.

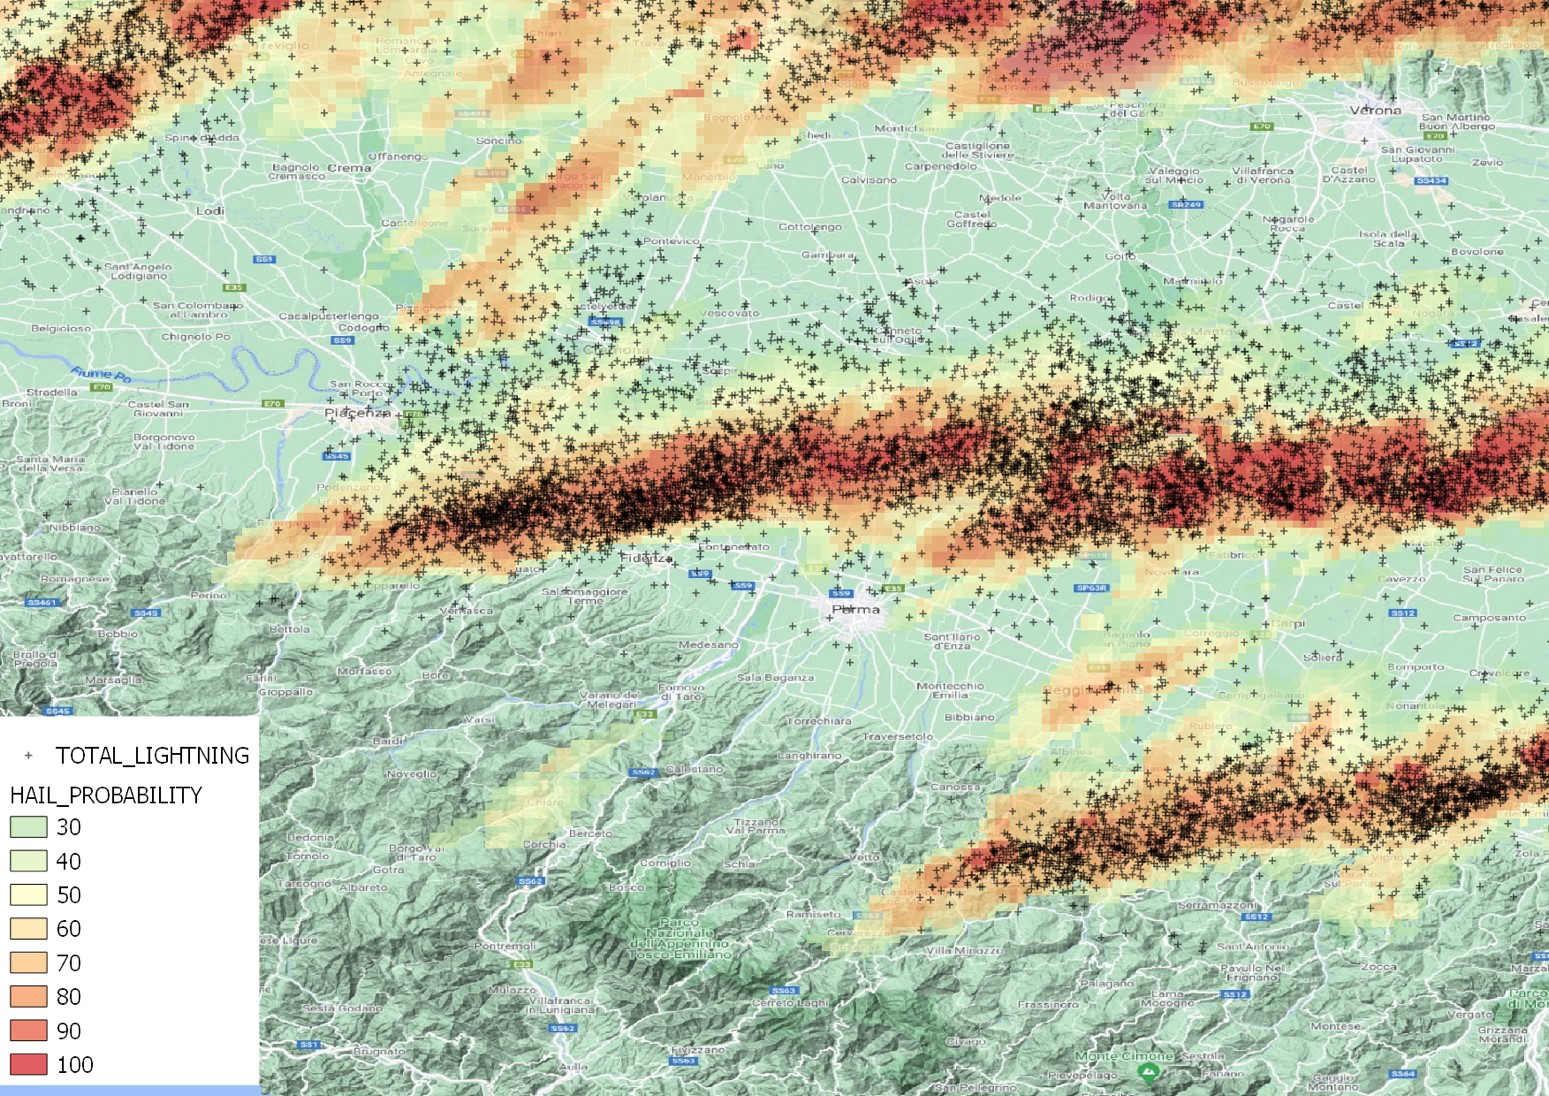
It has therefore been decided to approach hail detection using meteorological data from remote sensing networks, in particular radar and lightning, as they allow complete, continuous and fairly homogeneous monitoring of the area.

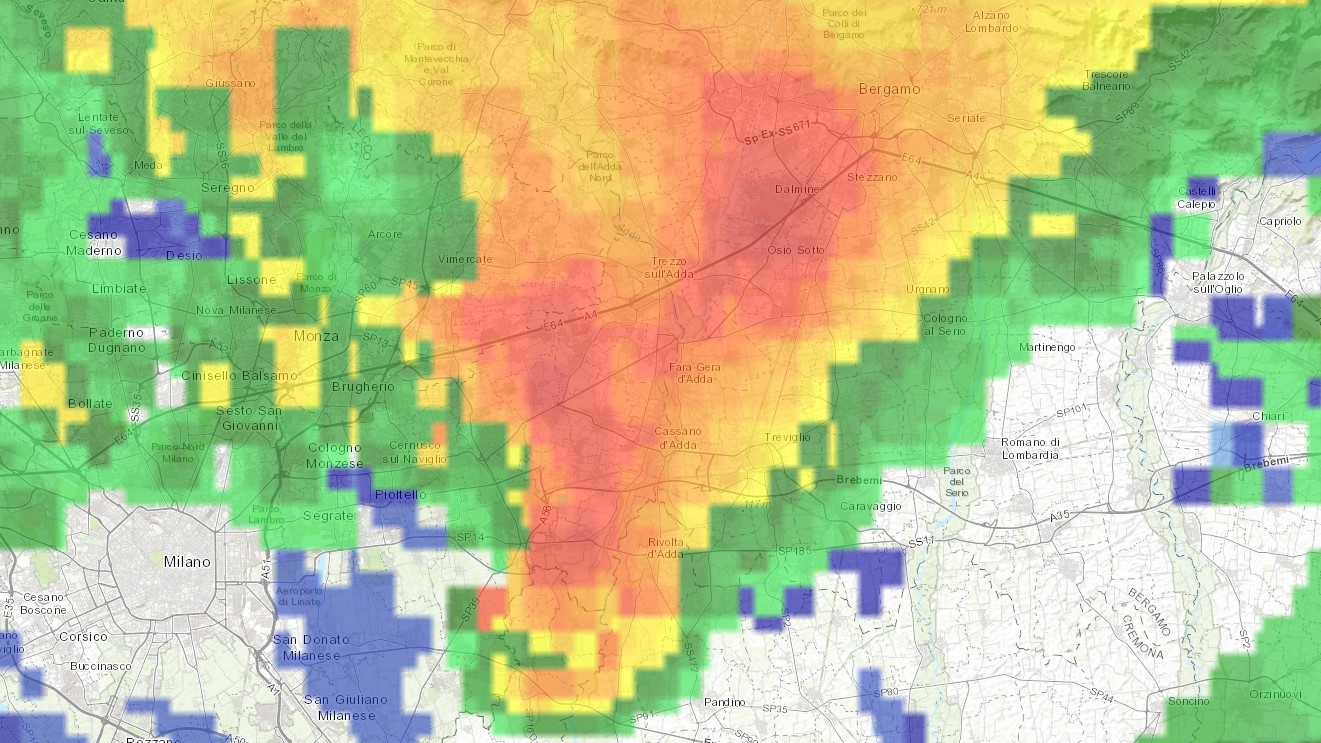
Meteorological radars are used to detect atmospheric precipitation (rain, hail and snow) in real time. The great effectiveness of this instrument lies in its ability to provide a clear and immediate picture of what is really happening in the area. In fact, the information provided by radar is not punctual, but it is real-time and very accurate, with a level of detail of up to one square kilometre (Fig. 1).

The use of meteorological radar is fundamental to thunderstorm detection. These phenomena can be particularly intense but also so limited in extent that they may not be measured by the individual weather stations in the area.

Radar image recordings make up an archive of great evidential value for ex-post meteorological analyses.

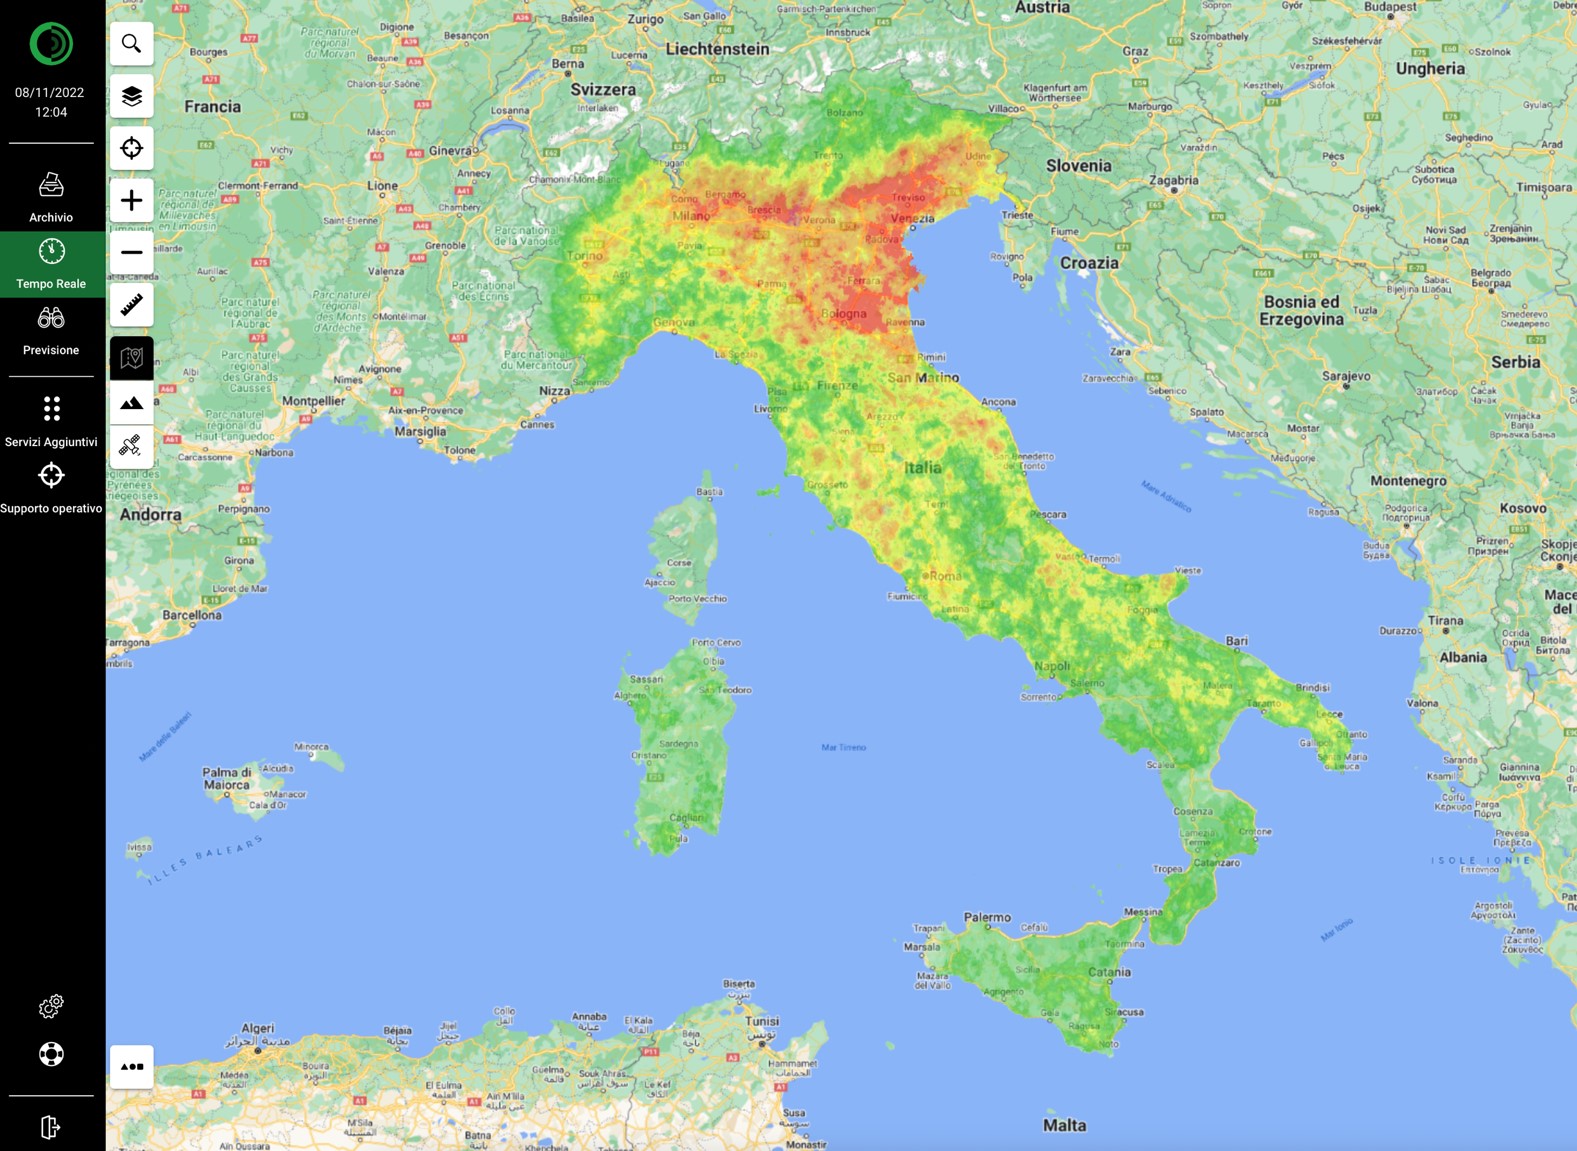
Italy is covered by the Civil Protection Department’s radar network, which has around 30 detection antennas.

Fig. 1 Weather radar image of a storm cell

The variable measured by the radar antenna is known as reflectivity, which is an indirect measure of precipitation intensity. Hail tends to have a very high reflectivity value, so the probability of its presence is strongly correlated with the reflectivity value measured by the instrument.

As for lightning, it is a phenomenon closely correlated with the intensity of the storm cell: the higher its frequency, the more intense the air currents within the storm and the greater the probability that hail, which is always present in storm systems, will reach a size large enough to hit the ground without melting on the way down.

Fig. 2 Hail and lightning probability index of 26/07/2021 over the area of Parma, where an intense hail event occurred, affecting the A1 motorway near Fidenza.

Hail probability and related index

The simultaneous use of radar and lightning data – which, as noted above, is clearly correlated with the hail phenomenon – has allowed the development of an index that gives the percentage probability of hail for a given reflectivity value and lightning density.

The hail probability index is calculated hourly (hourly hail probability) and can also be provided as a daily aggregation (daily hail probability, Fig. 2). The spatial resolution of the index is 1 km over the whole country.

The index has been calibrated and validated using observations from the European Severe Weather Database (ESWD).

Hail Risk Score

The statistical analysis of the daily hail probabilities for the last 5 years (2016-2021) made it possible to develop a hail risk score: the area is classified on a scale from 0 to 10 according to the frequency of hail events at that point (Fig. 3). The spatial resolution of the index is 1 km over the whole country in hail risk maps.

Fig. 3 Hail risk index map of Italy.
Fig. 4 Hail size estimation using the method proposed by Hypermeteo for 4 July 2023, at 13:30 UTC, when hailstorms with hailstone diameters of 2 cm occurred in L'Aquila in the Abruzzo region and 1 cm in Capracotta in the Molise region at 13:20 UTC and 13:25 UTC respectively

Size of hailstones estimation: a new tool to support risk management

Hail events cause significant damage to buildings, cars, infrastructure and agriculture with profound implications for insurance companies and, in severe cases, reinsurance companies.

To meet the needs of these sectors, Hypermeteo has developed an algorithm to accurately represent the areas affected by hail and estimate the size of hailstones.  This algorithm integrates observed variables, model data and machine learning techniques and has been validated and tested on a database of around 6000 events.

The validation phase of the algorithm showed that the methodology is able to estimate hailstone size much more accurately than commonly used techniques, especially in the 0-5 cm diameter range.

The algorithm has been used to create the first national hailstone size dataset at a 1-km resolution from 2022 to the present, and is being used operationally to continuously update the dataset in near real time.

Some of our customers